Lecture 4: Data Visualization: What and Why?
2026-01-27
Data Visualization
What and Why?
Data Vis: What and Why?
This lecture is based on Chapter 2 of Visualization Analysis & Design.
“What’s Vis, and Why Do It?”
The Big Picture
The definition of visualization structuring this book
(and thus, this course):
Computer-based visualization systems provide visual representations of datasets designed to help people carry out tasks more effectively.
The Big Picture
Munzner continues on, building out a framework for the book (1/3):
Visualization is suitable when there is a need to augment human capabilities rather than replace people with computational decision-making methods. The design space of possible vis idioms is huge, and includes the considerations of both how to create and how to interact with visual representations.
The Big Picture
Munzner continues on, building out a framework for the book (2/3):
Vis design is full of trade-offs, and most possibilities in the design space are ineffective for a particular task, so validating the effectiveness of a design is both necessary and difficult.
The Big Picture
Munzner continues on, building out a framework for the book (3/3):
Vis designers must take into account three very different kinds of resource limitations: those of computers, of humans, and of displays. Vis usage can be analyzed in terms of why the user needs it, what data is shown, and how the idiom is designed.
The Big Picture
This definition raises a series of questions that help describe the rationale for this definition and the scope of the book (and, again, this course).
Why have a human in the loop?
Some tasks are so well understood that we can automate solutions.
For example, stock brokers have algorithms that can automatically (and nearly instantaneously) trade stocks based on predetermine criteria.
For these tasks, you wouldn’t design a tool that helps humans make decisions faster, because the algorithms are already thousands of times faster than even a human armed with great tools.
Why have a human in the loop?
But other tasks are not clearly understood or clearly specified.
In these cases, an analysis process with a human in the loop is preferable.
Why have a human in the loop?
We have powerful pattern detection abilities that are still better than what an unsupervised computer can accomplish.
Visualization systems are thus used when the goal is to augment human capabilities, rather than replace the human.
Why have a human in the loop?
It makes sense to create visualization tools to:
- Gain a clearer understanding of a system you wish to eventually automate.
- Evaluate automation success in the middle of a transition.
- Monitor whether the automated system is performing well according to human judgement.
Why have a human in the loop?
It makes sense to create visualization tools to:
- Augment humans indefinitely, for example, exploratory analysis tools for generating hypotheses.
- Present or explain knowledge to others.
- I have a feeling most of us are here for this one.
Why have a computer in the loop?
Computers can:
- Draw and present large datasets that would be completely infeasible to draw by hand.
- Recreate visualizations “on the fly” when datasets are updated.
- Important for reproducibility.
Why use an external representation?
External representations augment human capacity.
We have limits to our internal cognition and memory.
Visualizations replace cognition with perception.
Why depend on vision?
The human visual system provides a very high-bandwidth channel to our brains.
A significant amount of visual information processing occurs in parallel at the preconscious level.
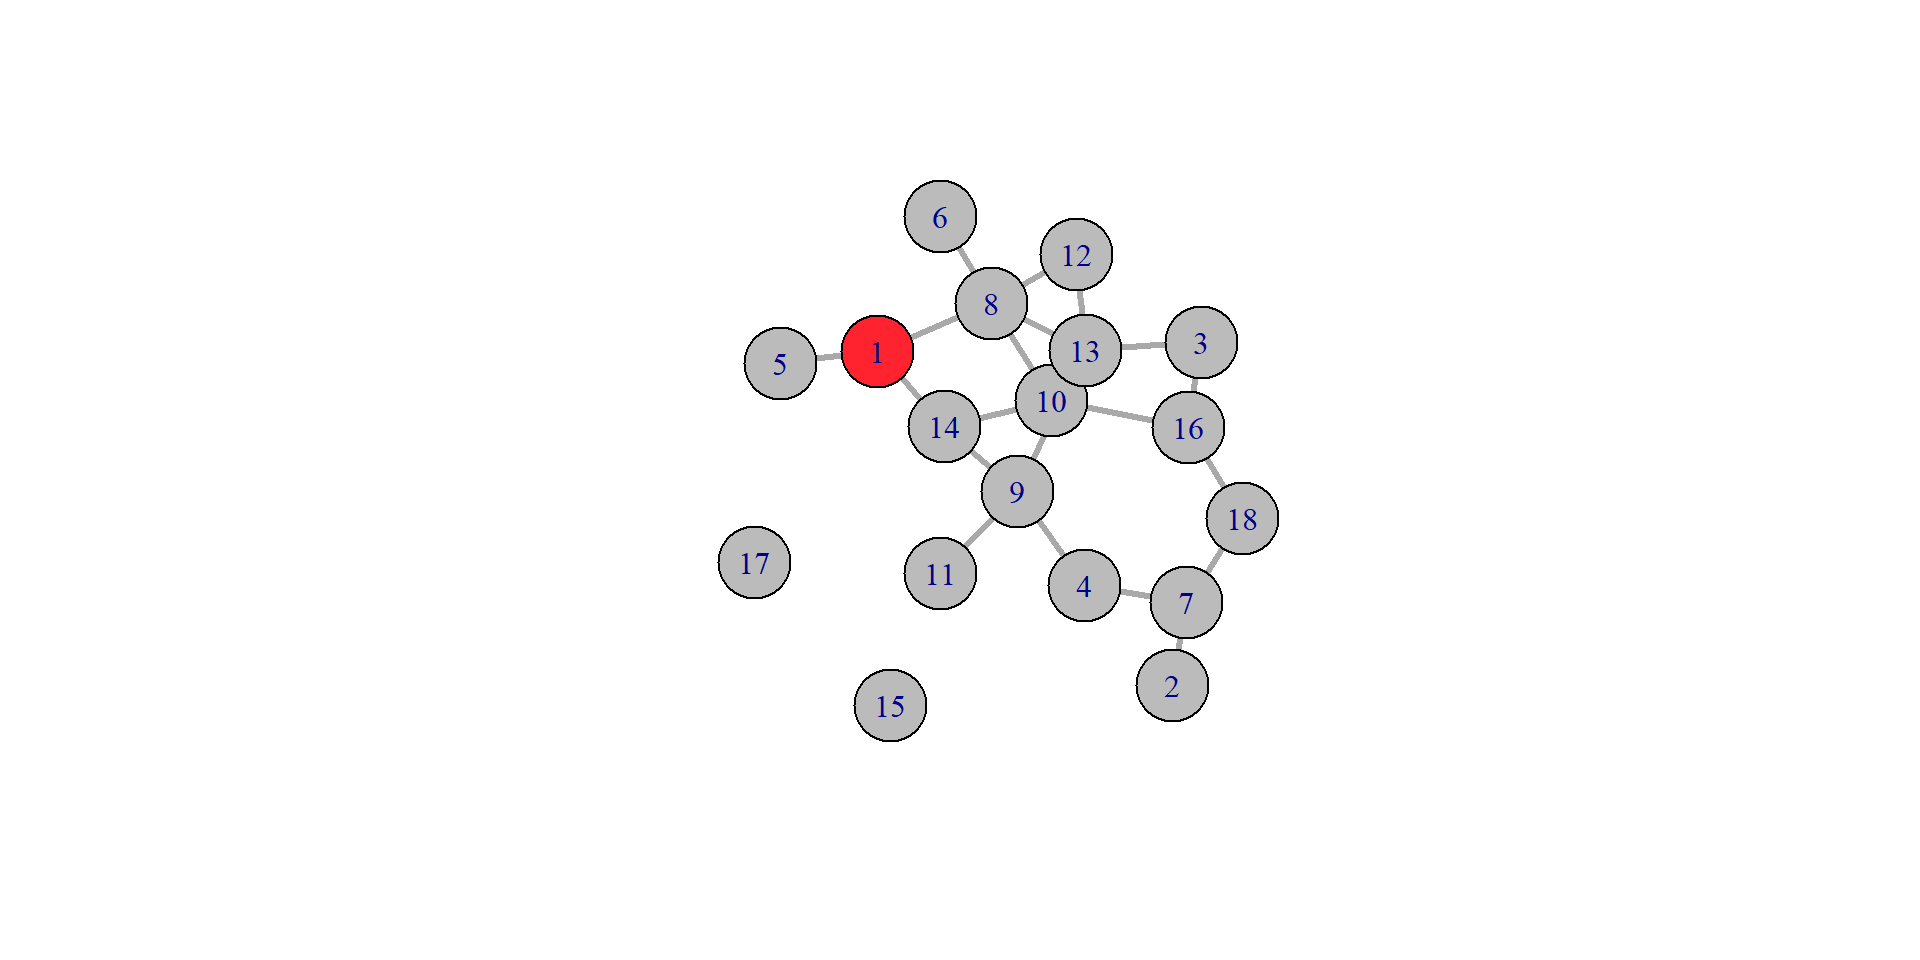
For example, visual popout is what allows you to immediately recognize the red object in a sea of gray ones.
Why depend on vision?
Sound is a poor choice for convey a large amount of information.
We can separate an enormous amount of visual information and process it in parallel, but we experience sound in a sequential stream.
Why depend on vision?
Our other senses are mostly unused because of technological limitations:
- We can’t reliable record and reproduce taste or smell.
- We have some haptic input and feedback devices, but they cover only a small part of our perceptual range for touch and kinesthetic senses.
- Apparently active research in this field.
Why show the data in detail?
Numerical summaries lose information. The “famous” example is Anscombe’s quartet.
All four datasets have the same mean, variance, correlation coefficient, and linear regression lines.

Why show the data in detail?
Anscombe’s quartet shows that a single summary is often an oversimplification of the true structure in a dataset.
This applies even more strongly to large and complex datasets.
Why use interactivity?
Interactivity is where user actions cause the view to change.
For large datasets, limitations of humans and of displays cause visualizations to mask complexity.
Interactively changing visualizations can allow a user to investigate many possible queries.
Why is the vis idiom design space huge?
A visualization idiom is a distinct approach to creating and manipulating visual representations.
Why is the vis idiom design space huge?
From the Merriam-Webster Dictionary:
Idiom: a style or form of artistic expression that is characteristic of an individual, a period or movement, or a medium or instrument.
Why is the vis idiom design space huge?
Unfortunately, Munzner doesn’t directly answer this question. But she goes on to say:
This book provides a framework for thinking about the space of vis design idioms systematically by considering a set of design choices…
So I guess we’ll find out the answer together!
Why focus on tasks?
Tools are designed to be task-specific.
Reframing a user’s task from domain-specific to an abstract form can highlight similarities and differences between visualizations in different fields.
For example, visualization can be used to generate new hypotheses when exploring a completely new dataset, or it can be used to test existing hypotheses in a system already better understood.
Why focus on effectiveness?
I think this is somewhat self-evident.
From the book:
The focus on effectiveness is a corollary of defining vis to have the goal of supporting user tasks.
Why are most designs ineffective?
The possible design space is much larger than the optimal design space.
Why is validation difficult?
The problem of validation is identifying whether the visualization tool meets your design goals.
- How do you know if it works?
- What does better mean?
- What does effectively mean?
- Can you measure insight or engagement?
- Who is the user?
Why is validation difficult?
- Even a concept like faster is tricky:
- Are users limited by computer speed?
- Or by the speed of their own cognition?
- How can you collect benchmark data?
Why are there resource limitations?
Again, I argue this is self-evident
Some limitations:
- Scalability (to bigger datasets)
- Data acquisition
- Data processing
- Computer memory
- Human memory and attention
Why are there resource limitations?
Change blindness occurs when even very large changes are not noticed if we are paying attention to something else in our view.
Information density is a measure of the amount of information encoded versus the amount of unused space.
Why analyze?
Analyzing existing visualizations is a good stepping stone to designing new ones.
Munzner relates this analysis to three questions:
- What data does the user see?
- Why does the user intend to use this visualization tool?
- How are the visual encoding and interaction idioms constructed (design choices)?