| ID | Name | Age | Shirt.Size | Favorite.Fruit |
|---|---|---|---|---|
| 1 | Amy | 8 | S | Apple |
| 2 | Basil | 7 | S | Pear |
| 3 | Clara | 9 | M | Durian |
| 4 | Desmond | 13 | L | Elderberry |
| 5 | Ernest | 12 | L | Peach |
| 6 | Fanny | 10 | S | Lychee |
| 7 | George | 9 | M | Orange |
| 8 | Hector | 8 | L | Loquat |
| 9 | Ida | 10 | M | Pear |
| 10 | Amy | 12 | M | Orange |
Lecture 6: Data Abstraction
2026-02-03
Data Vis: What and Why?
This lecture is based on Chapter 2 of Visualization Analysis & Design.
“Data Abstraction”
Data Abstraction
Data Types
- Earlier, Munzner used the terminology type to refer to the structural interpretation of the data.
- Now, she uses data type to mean something different.
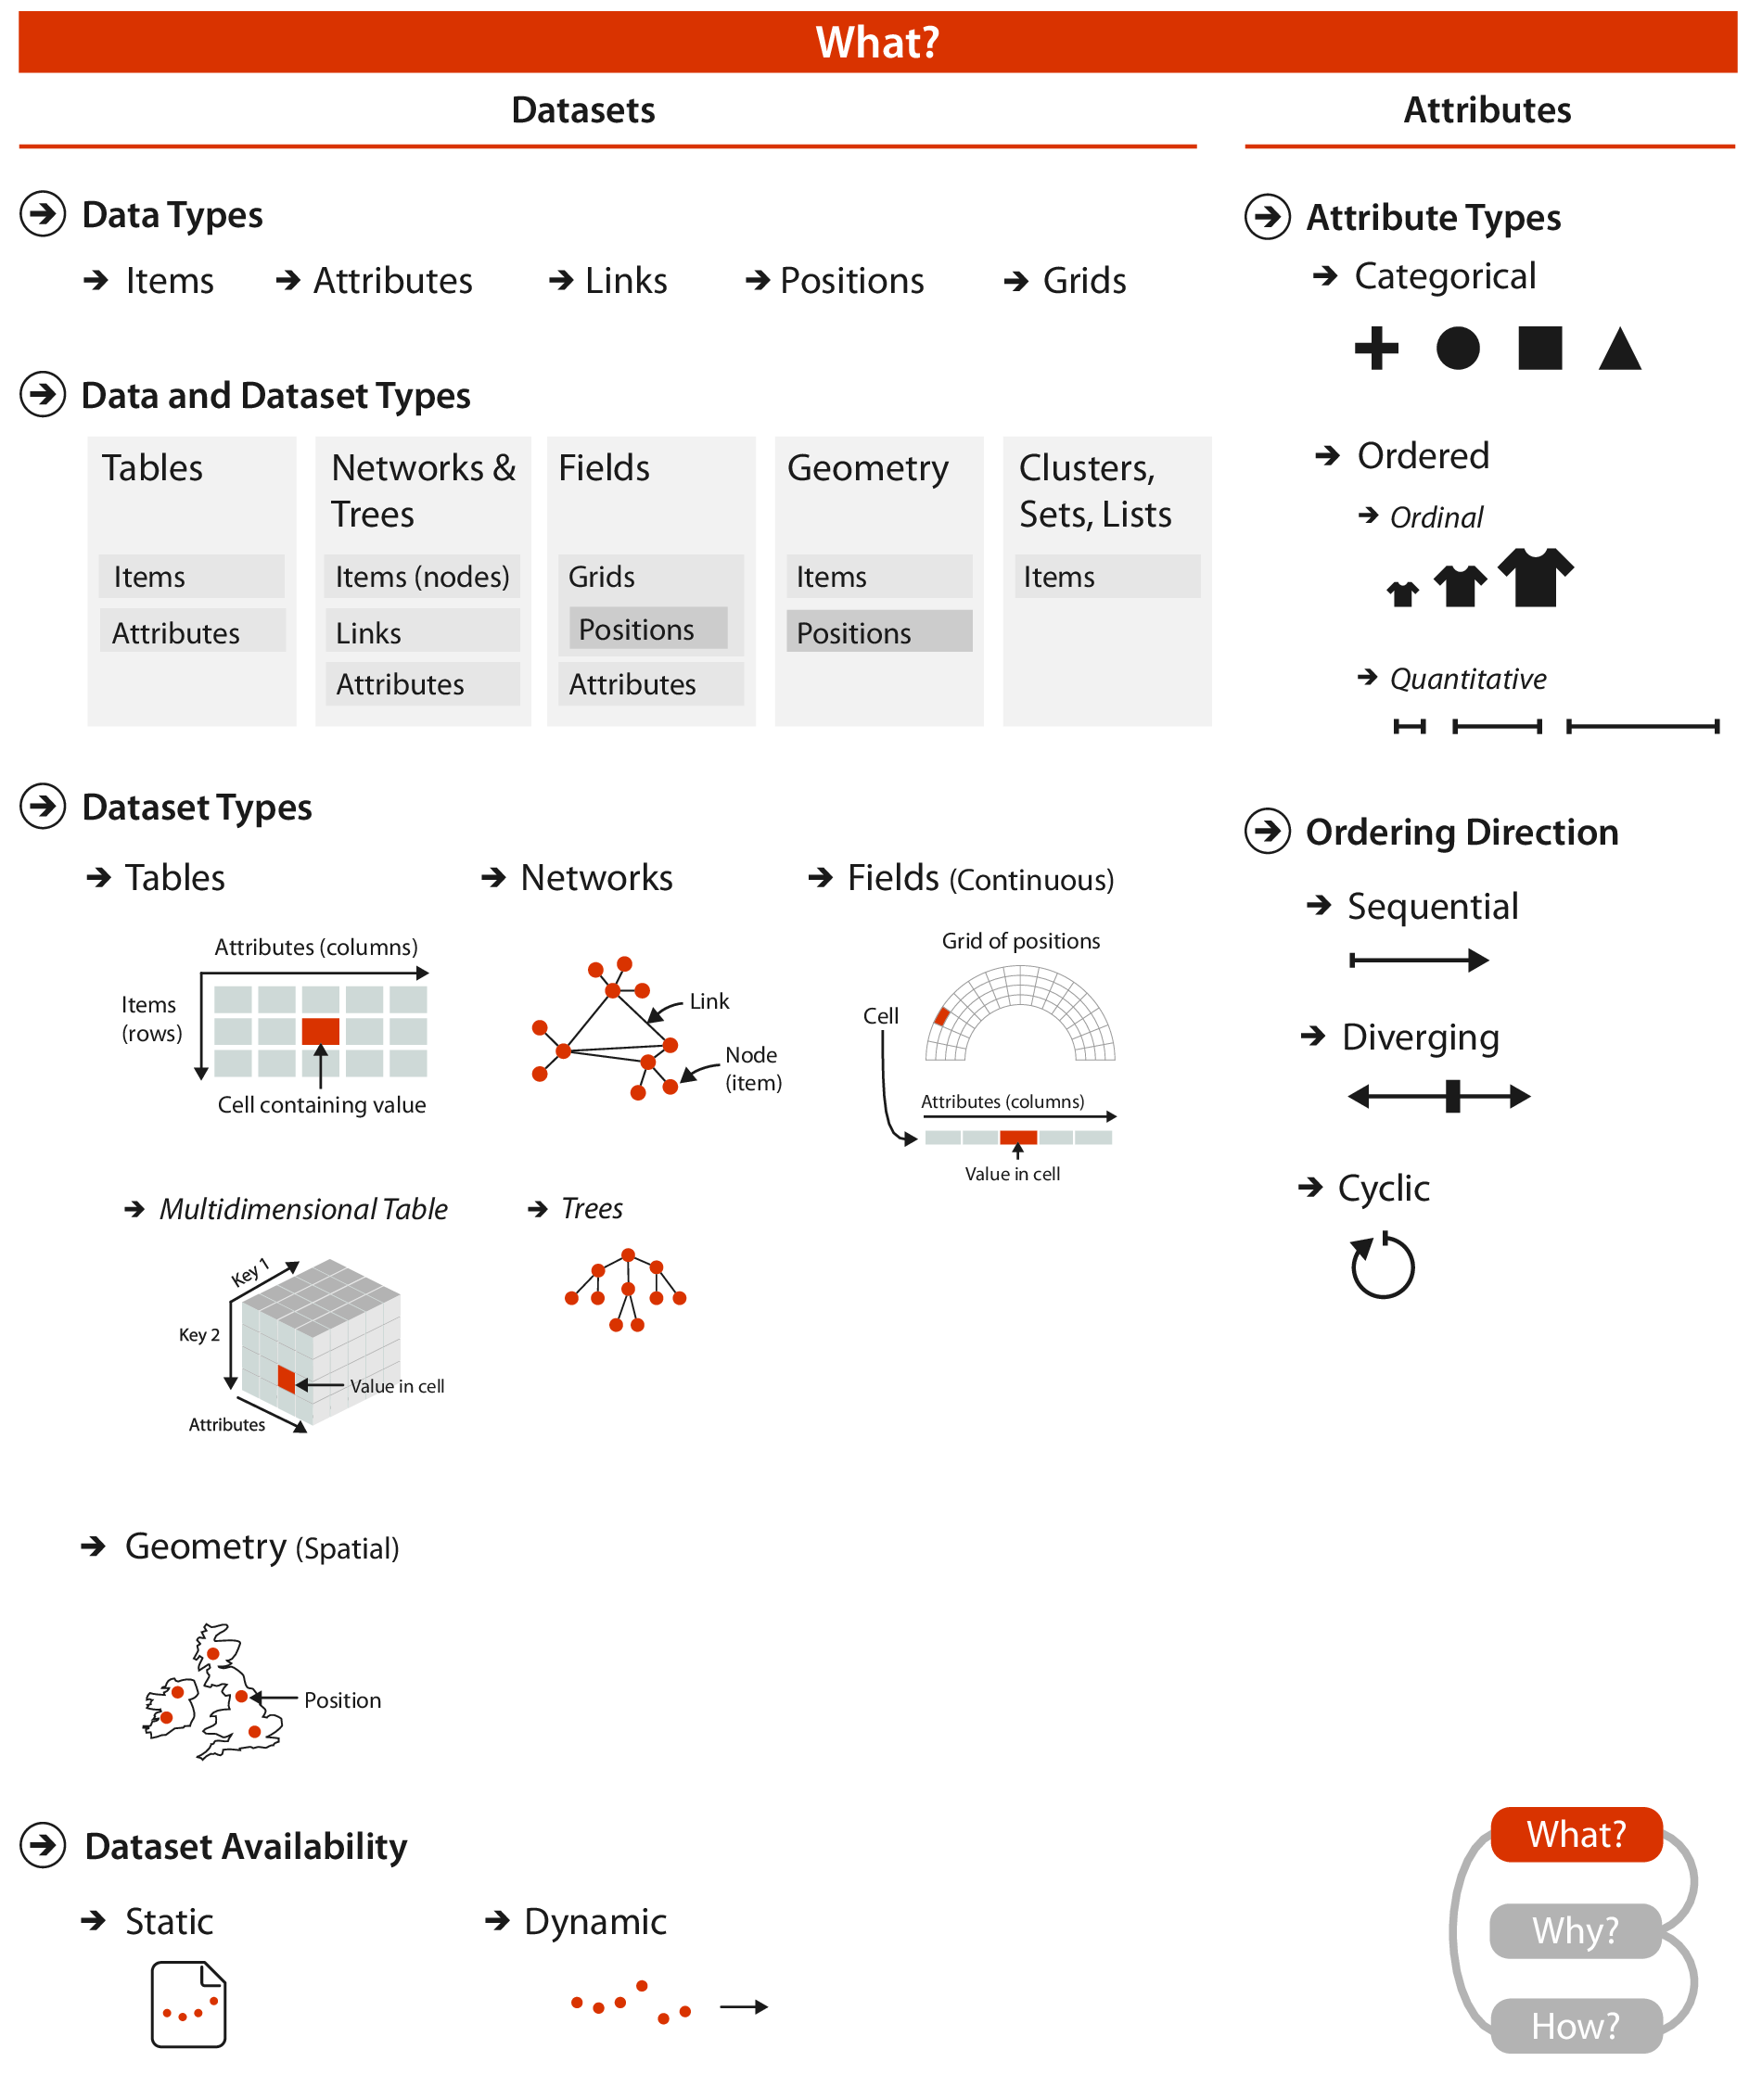
- The 5 basic data types discussed in this book are:
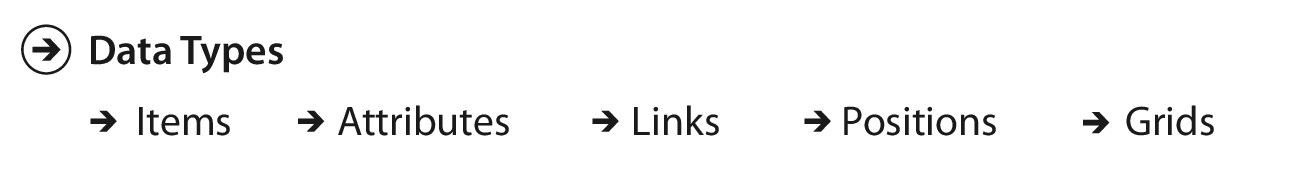
Data Types
An item is a discrete individual entity, such as a row in a table or a node in a network.
Data Types
An attribute is some specific property that can be measured, observed, or logged.
Data Types
A link is a relationship between items, typically within a network.
Data Types
A position is spatial data in 2D or 3D space.
Data Types
A grid is a sampling of continuous data in terms of both geometric and topological relationships between its cells.
Dataset Types
- A dataset is any collection of information that is the target of analysis.
- The 4 basic dataset types discussed in this book are:
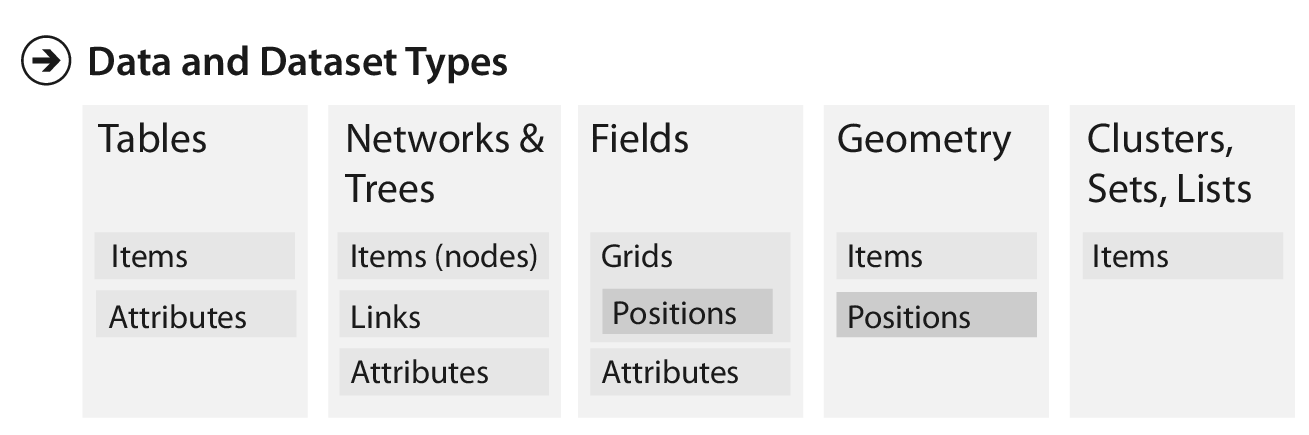
(Apparently, clusters, sets, and lists are other groupings of items).
Dataset Types
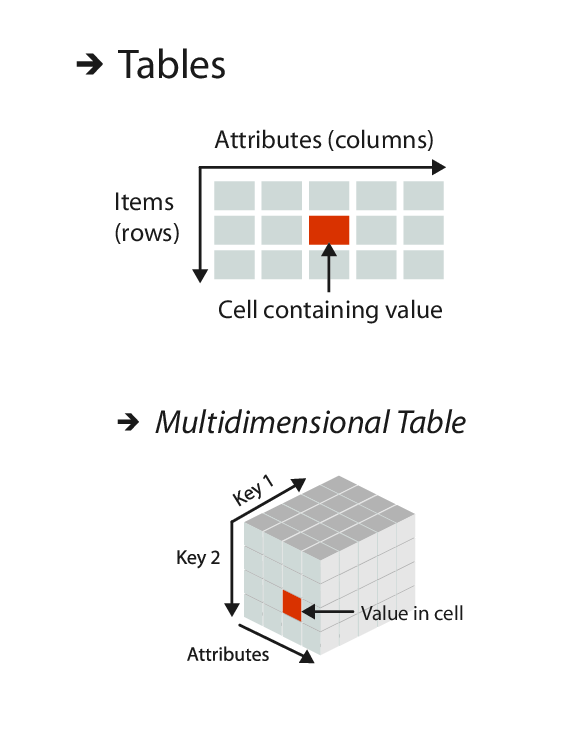
- Tables are the familiar arrangement of rows and columns, like a spreadsheet.
- For a simple flat table:
- Each row represents an item.
- Each column is an attribute of that item.
- Each cell is fully specified by row and column and contains a value.
Dataset Types
- A multidimensional table has a more complex structure for indexing into a cell, with multiple keys.
- A key serves as an index to lookup values.
Dataset Types
- A network is used to specify relationships between two or more items.
- An item in a network is referred to as a node.
- Nodes can have associated attributes.
- A link is a relation between two items.
- Links can also have associated attributes.
Dataset Types
- A network with hierarchical structure is called a tree.
- Trees cannot have cycles; each child node has only one parent node pointing to it.
Dataset Types
- A field contains attribute values associated with cells.
- Each cell contains measurements from a continuous domain.
- By contrast, tables and networks contain discrete items.
Dataset Types
- Continuous data require careful treatment of sampling to acheive the desired resolution.
- Interpolation can be used to show values in between sampled points in a way that does not mislead.
- Proper interpolation can be used to reconstruct a new view.
Dataset Types
- Spatial fields are based on sampling at spatial positions.
- Actual spatial positions constrain decisions about spatial arrangement of visualizations.
- Many spatial arrangement choices for nonspatial data are unavailable for spatial fields.
Dataset Types
- Geometry specifies information about the shape of items with explicit spatial positions.
- Like spatial fields, geometry datasets are intrinsically spatial.
- Geometry datasets do not necessarily have attributes.
Dataset Types
- Other combinations of items include sets, lists, and clusters.
- A set is an unordered group of items.
- A list is an ordered group of items.
- A cluster is a grouping based on attribute similarity.
Dataset Types
- There are also more complex structures built on networks.
- A path through a network is an ordered set of links connecting nodes.
- A compound network is a network with an associated tree.
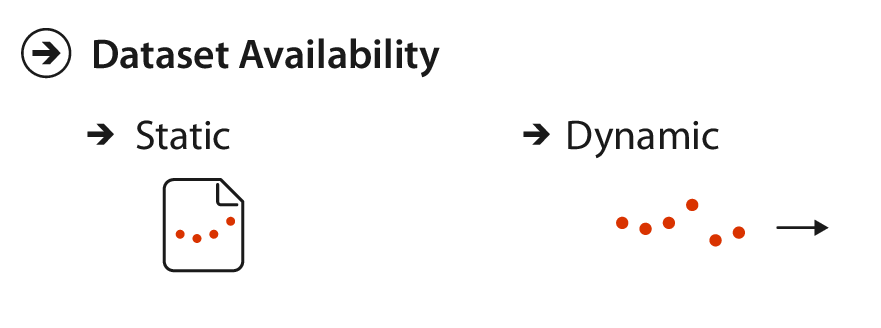
Dataset Availability
- In addition to dataset types, datasets may have different dataset availability.
- In a static file, all the data are available at once.
- Synonym: offline
- In dynamic streams, the dataset information trickles (really?) in during the course of the session.
- Synonym: online
- In a static file, all the data are available at once.
Attribute Types
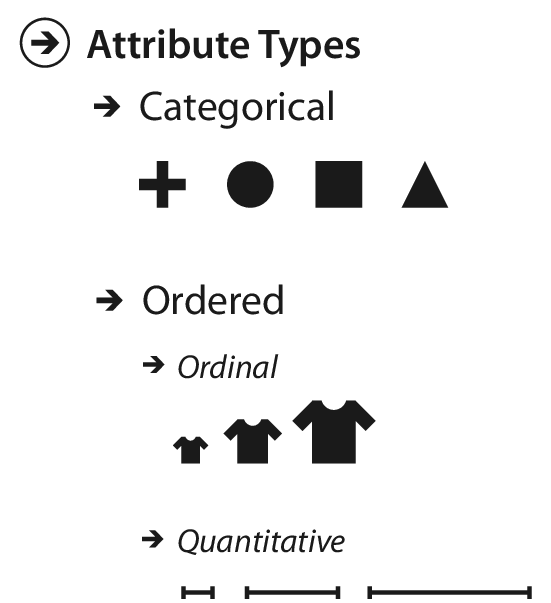
Attributes may be:
- Categorical
- Ordered
- Ordinal
- Quantitative
Attribute Types
- Categorical data does not have an implicit ordering, but it often has hierarchical structure.
- For example, favorite fruits.
- Two items can only be the same (apples) or different (apples vs. oranges).
Attribute Types
- Ordered data does have an implicit ordering.
- Ordinal data does not allow arithmetic, but the order is well-defined.
- E.g., t-shirt size (S < M < L)
- Quantitative data is a measurement of magnitude that supports arithmetic.
- Ordinal data does not allow arithmetic, but the order is well-defined.
Attribute Types
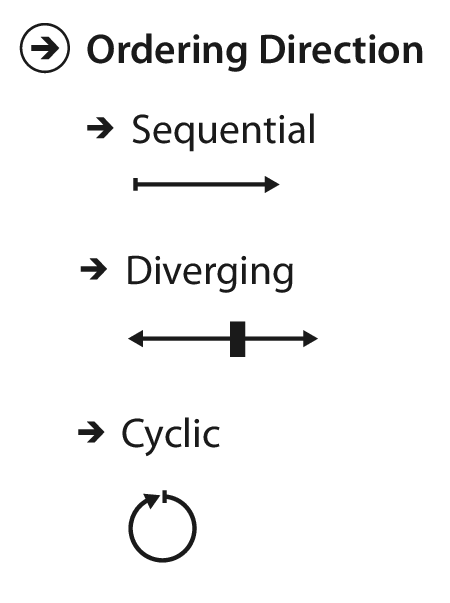
- Ordered data can be sequential, diverging, or cyclic.
- Sequential data have a homogeneous range from minimum to maximum value.
- E.g., mountain height (above sea level) or bathymetry (below sea level).
- Diverging data can be deconstructed into two sequences pointing in opposite directions (often meeting at 0).
- E.g., elevation (either above or below sea level).
- Sequential data have a homogeneous range from minimum to maximum value.
Attribute Types
- Ordered data can be sequential, diverging, or cyclic.
- Cyclic data have values that wrap around back to the start.
- E.g., hour of the day/day of the week/week of the year.
- Cyclic data have values that wrap around back to the start.
Key vs. Value Semantics
For a multidimensional table, multiple keys are required to identify a unique item.