Lecture 9: ggplot2
2026-02-19
ggplot2
Create elegant data visualizations using the Grammar of Graphics
The Grammar of Graphics
The Grammar of Graphics
Wilkinson (2005) created the grammar of graphics to describe the fundamental features that underlie all statistical graphics. The grammar of graphics is an answer to the question of what is a statistical graphic? ggplot2 (Wickham 2009) builds on Wilkinson’s grammar by focussing on the primacy of layers and adapting it for use in R. In brief, the grammar tells us that a graphic maps the data to the aesthetic attributes (colour, shape, size) of geometric objects (points, lines, bars). The plot may also include statistical transformations of the data and information about the plot’s coordinate system. Facetting can be used to plot for different subsets of the data. The combination of these independent components are what make up a graphic.
ggplot2 Basics
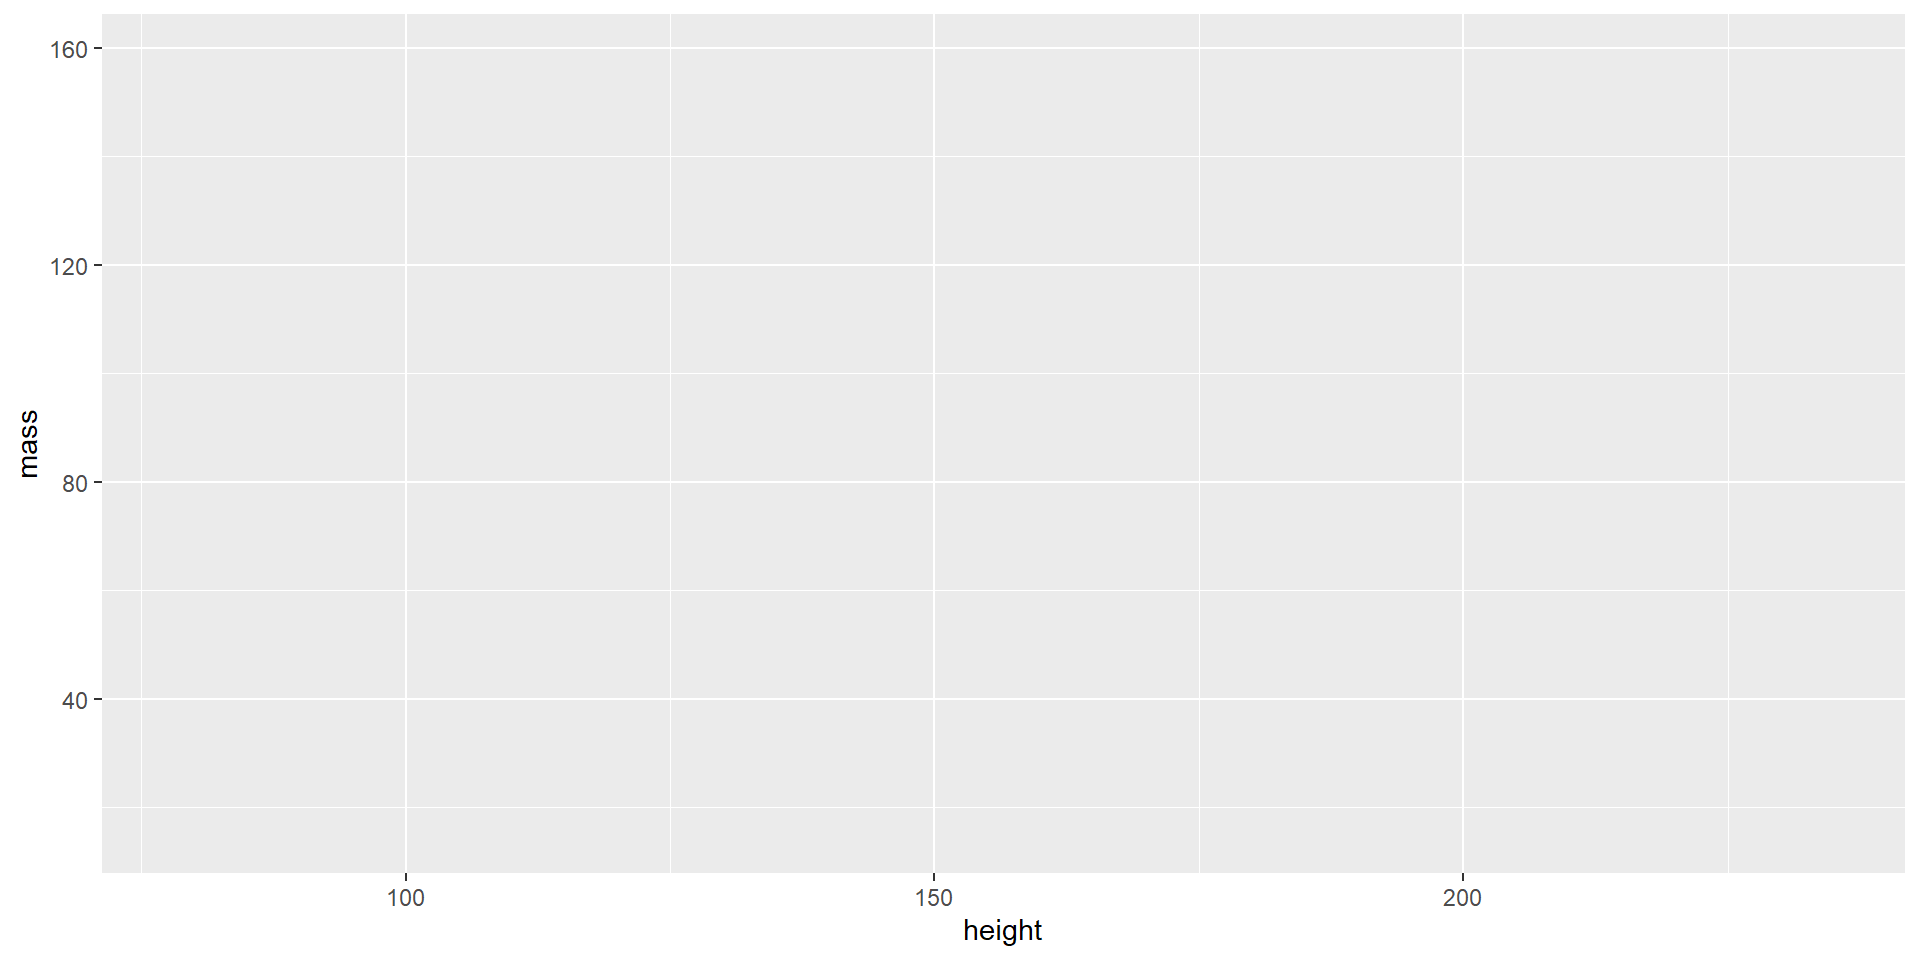
- Begin with
ggplot() - The first argument is
data, so you can (but don’t have to) specify that. - You can also easily pipe to
ggplot().

ggplot2 Basics
- The next argument is
mapping, which you use to define the aesthetics of your plot using the functionaes().- This is where you define which channels to use for which attributes.
ggplot2 Basics
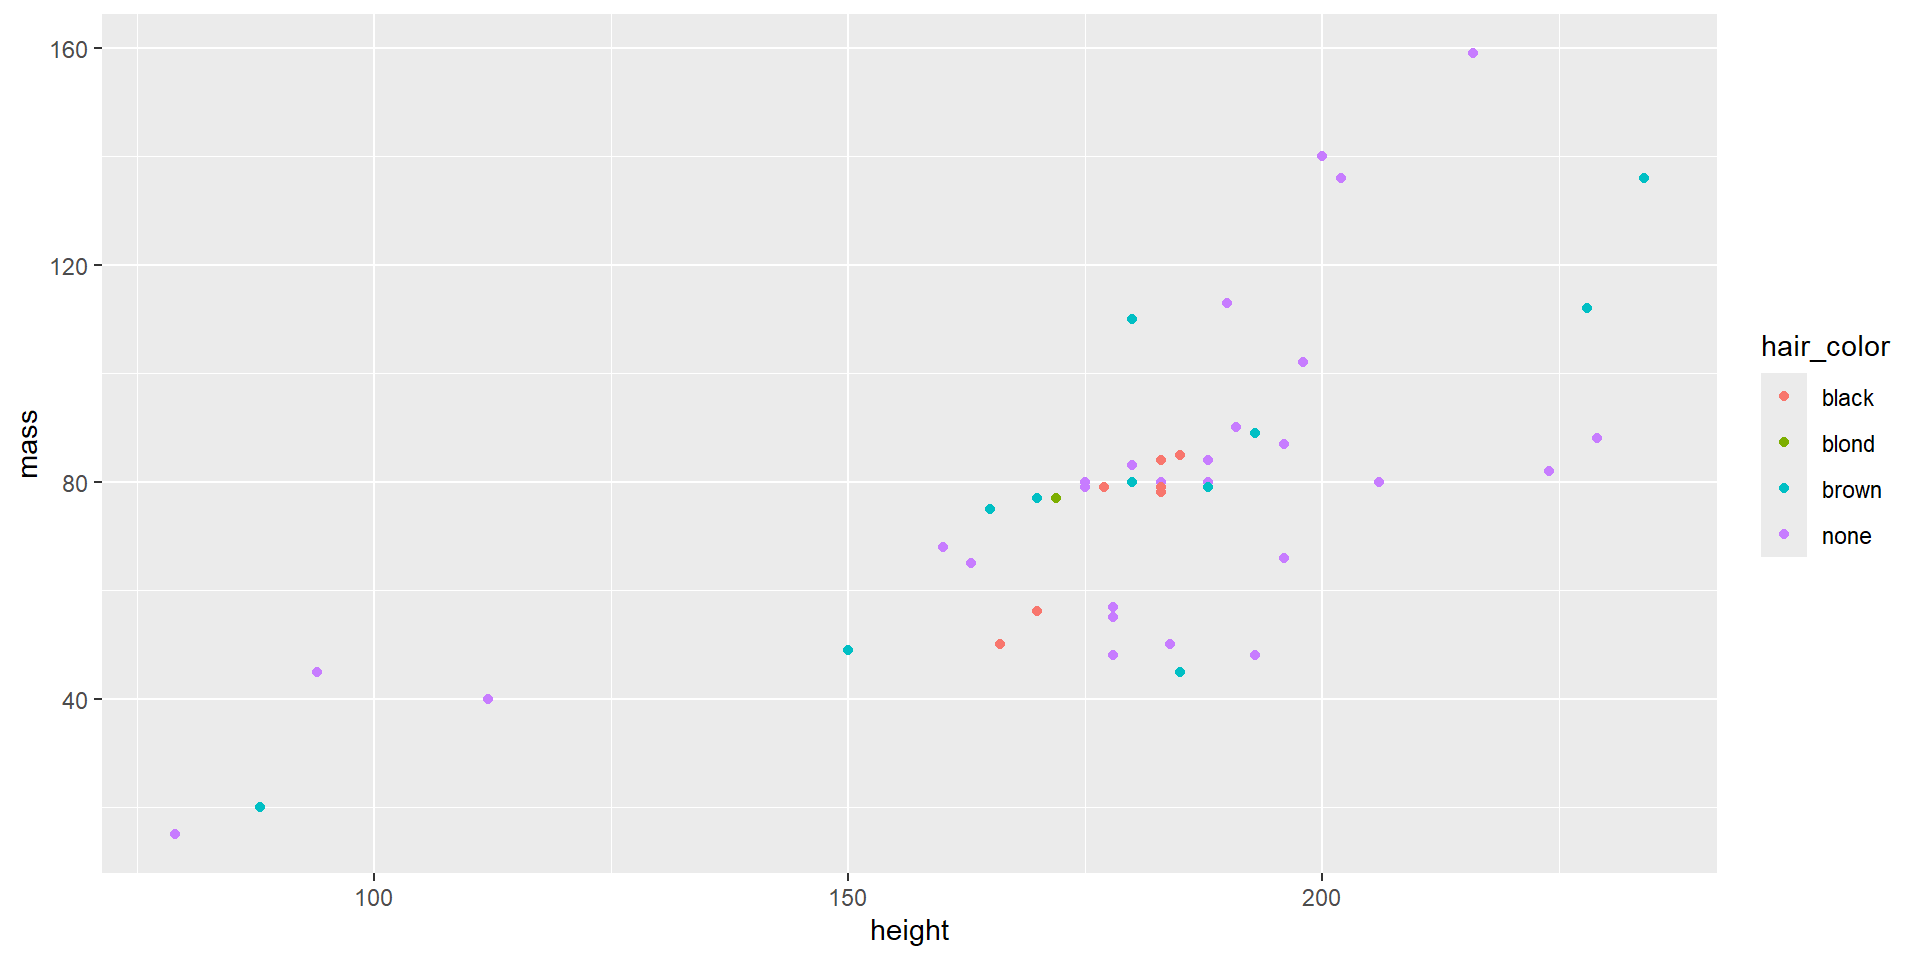
- Now you can add a geom, i.e., a mark.
- You can add more than one geom in layers.
- After calling
ggplot(), all layers and options are added to the plot using the+operator.
ggplot2 Basics
- Once you have all the layers, you can start tweaking the appearance of layers, marks, or channels.
Code
starwars %>%
  filter(hair_color %in% c("blond", "brown", "black", "none"),
         !is.na(mass)) %>%
ggplot(aes(x = height, y = mass, color = hair_color)) +
geom_point() +
xlab("Height (cm)") +
ylab("Mass (kg)") +
ggtitle("Mass by Height and Hair Color",
subtitle = "in the Star Wars universe") +
scale_color_manual(name = "Hair Color",
breaks = c("blond", "brown", "black", "none"),
values = c("gold", "brown", "black", "gray"))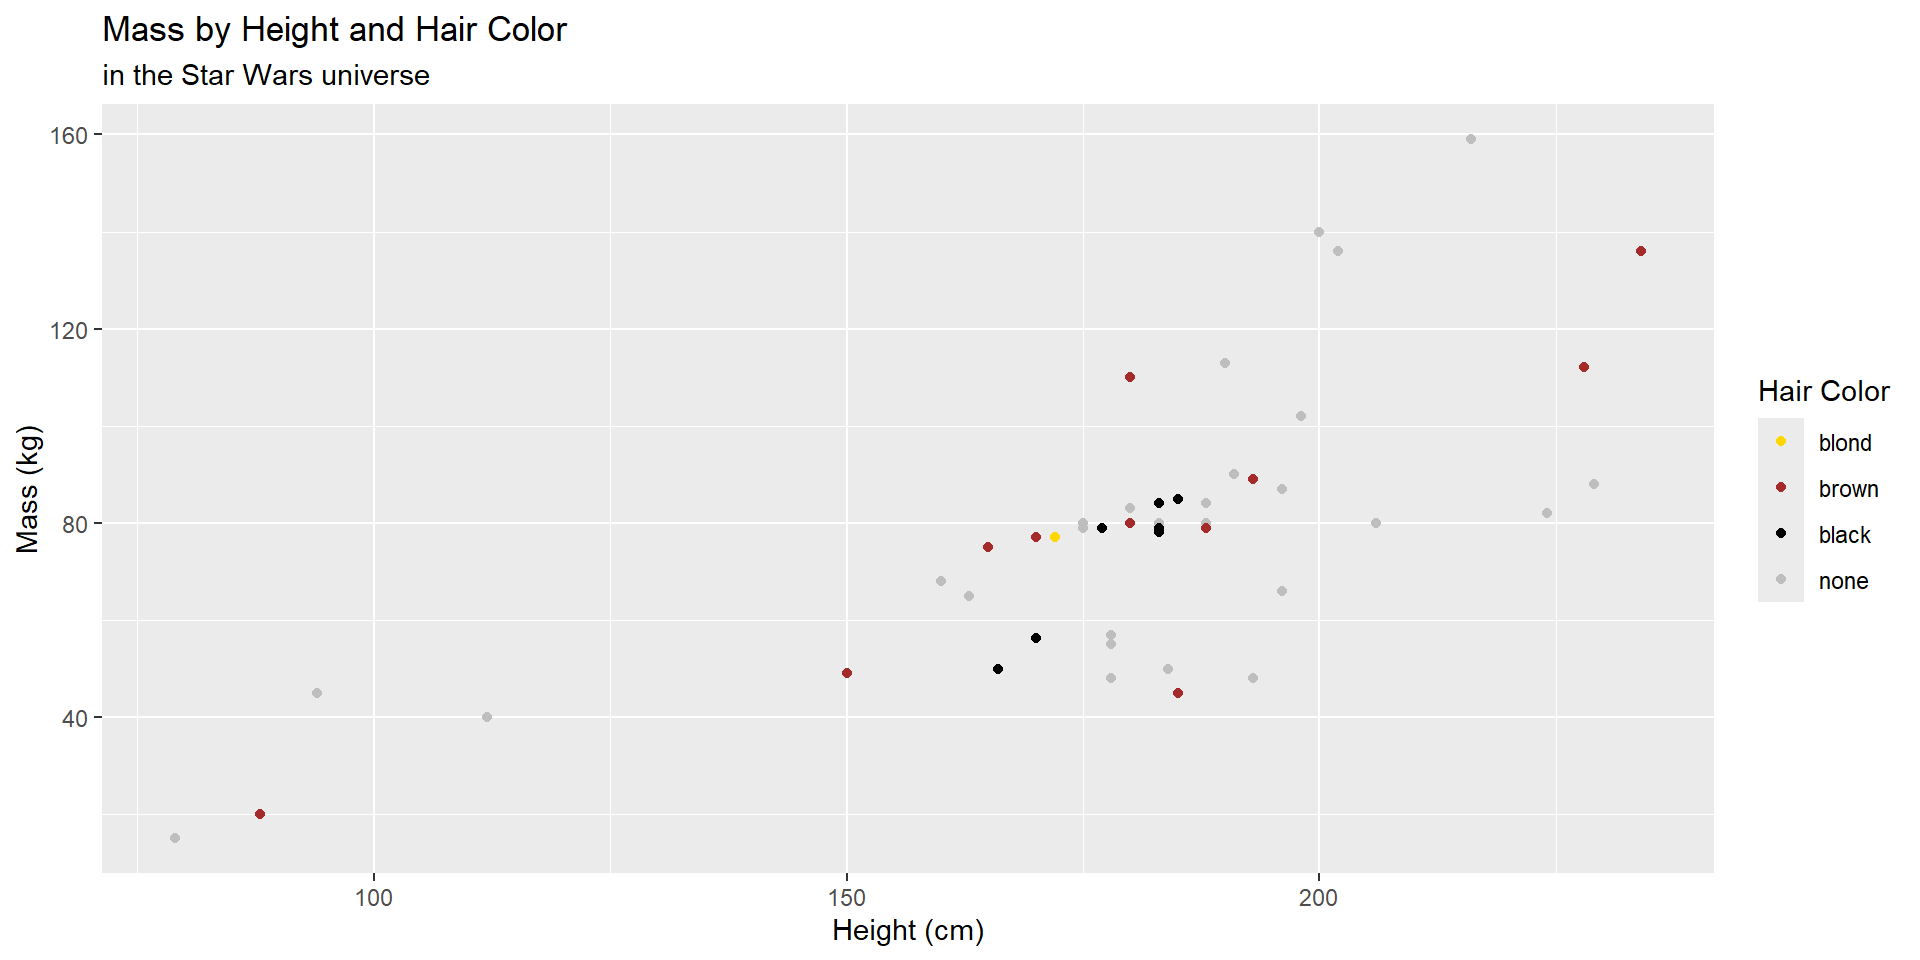
ggplot2 Basics
- Other tweaks might include:
- adding facets to change the view.
- changing the overall appearance with themes.
Code
starwars %>%
  filter(hair_color %in% c("blond", "brown", "black", "none"),
         !is.na(mass)) %>%
  ggplot(aes(x = height, y = mass, color = hair_color)) +
geom_point() +
xlab("Height (cm)") +
ylab("Mass (kg)") +
ggtitle("Mass by Height and Hair Color",
subtitle = "in the Star Wars universe") +
scale_color_manual(name = "Hair Color",
breaks = c("blond", "brown", "black", "none"),
values = c("gold", "brown", "black", "gray")) +
facet_wrap(~ hair_color) +
theme_bw() +
theme(text = element_text(size = 16))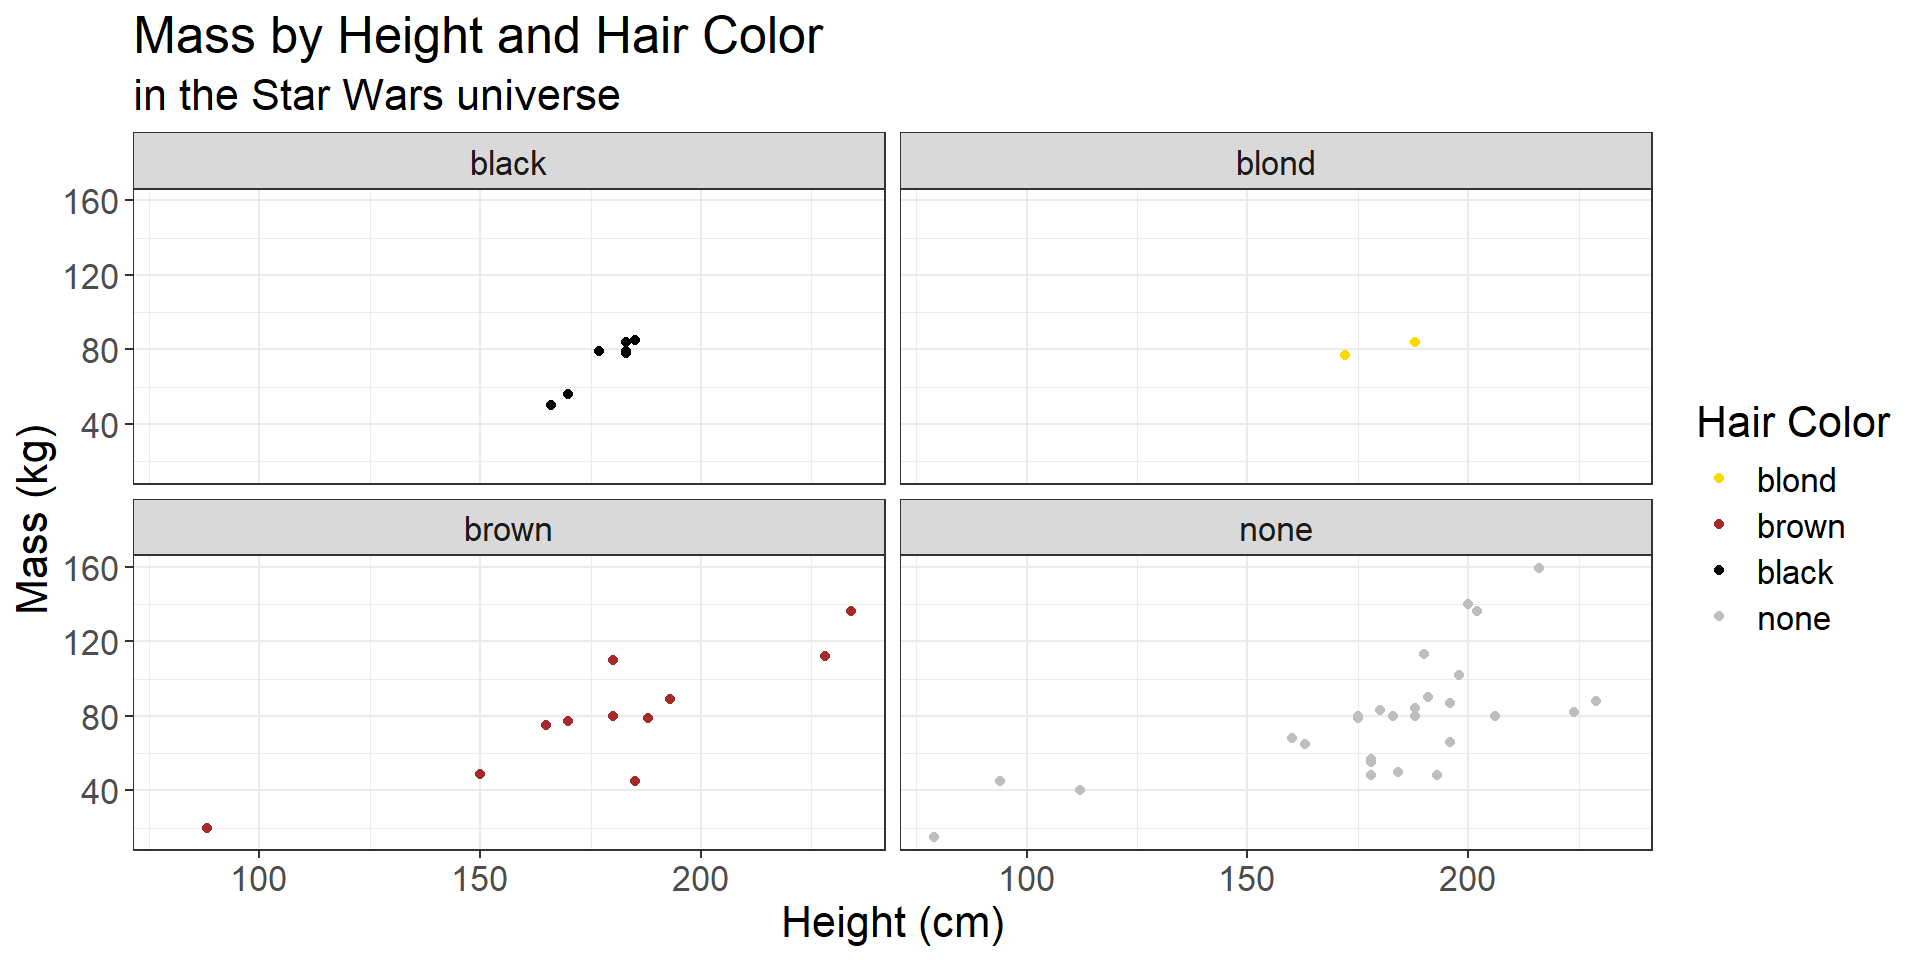
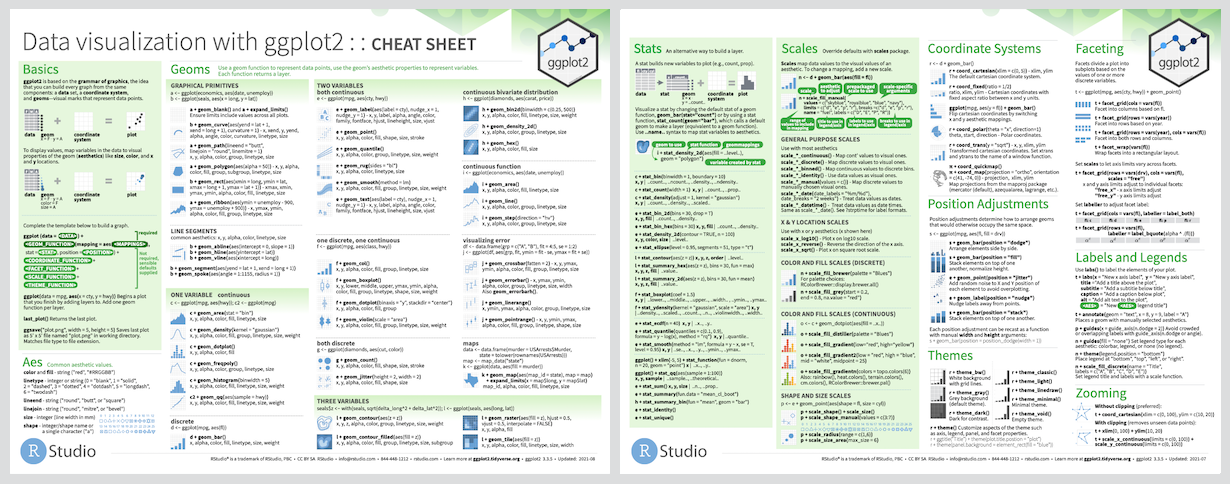
ggplot2 Cheatsheet