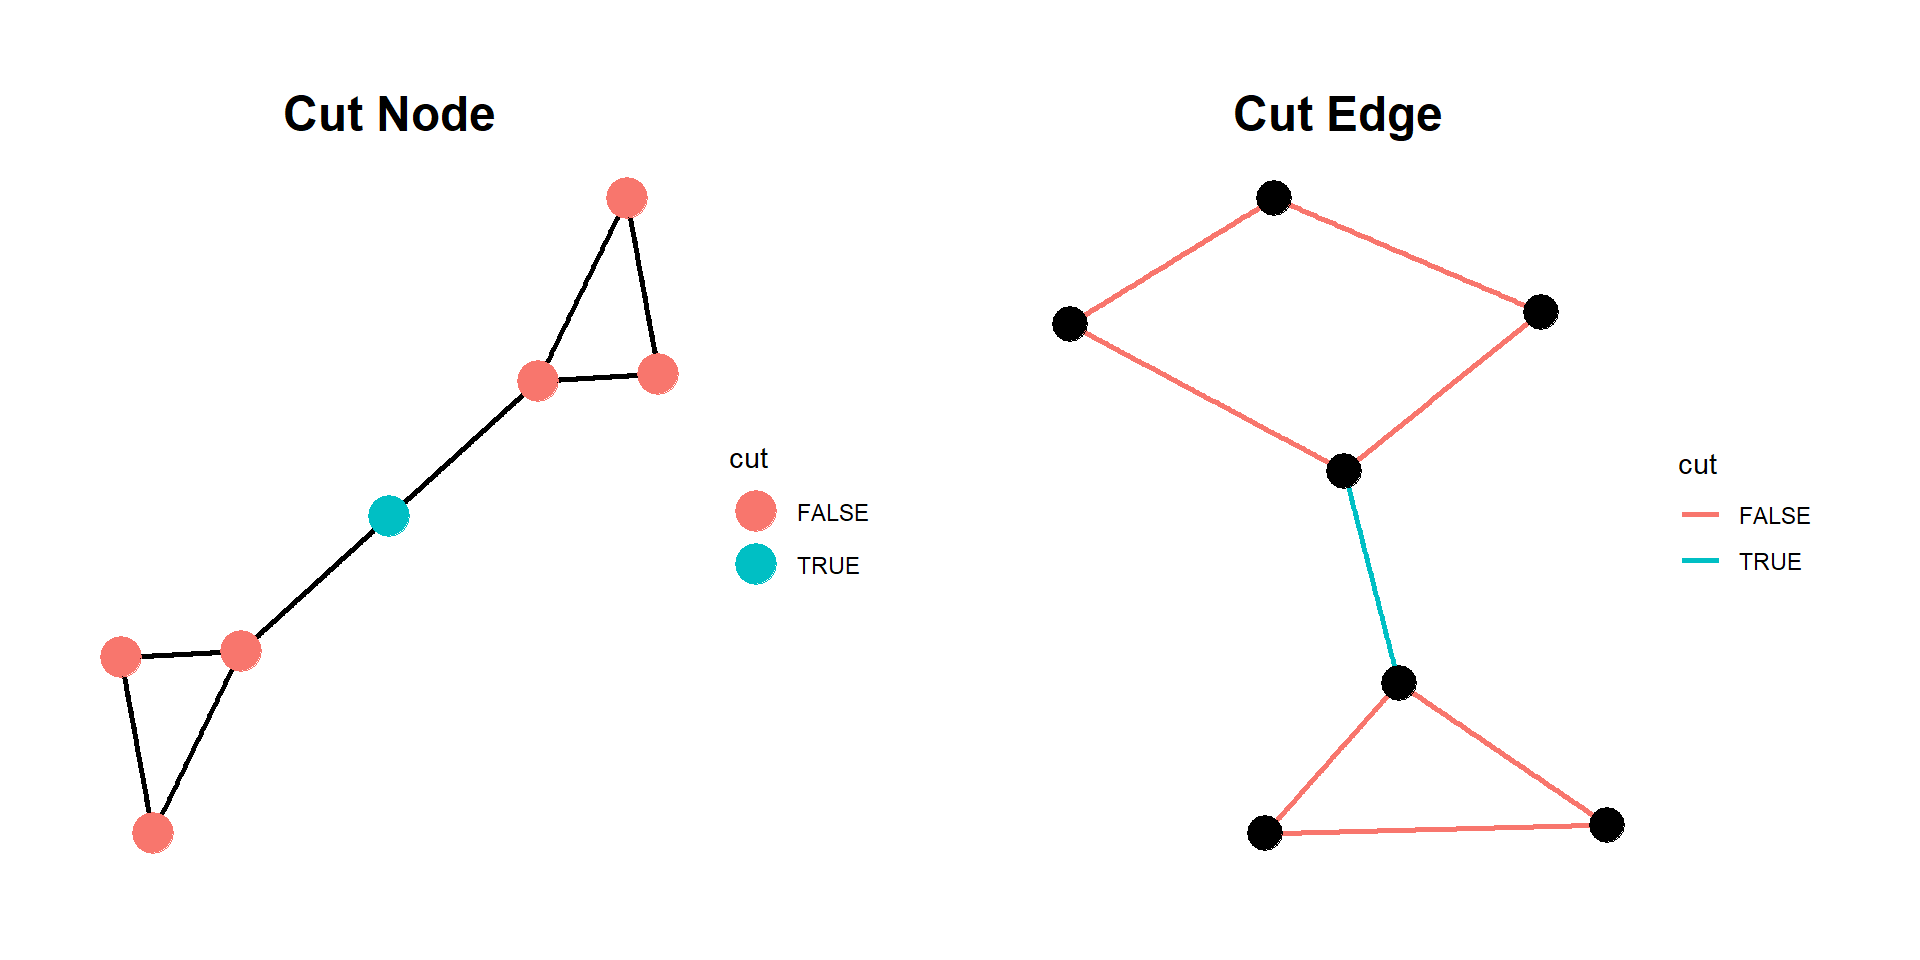
# Create a graph
g1 <- make_graph(edges = c(1, 2, 2, 3, 3, 1,
                           # Node 4 is cut node
                           3, 4, 4, 5,
                           5, 6, 6, 7, 7, 5),
                 directed = FALSE) %>%
  set_vertex_attr(name = "cut", value = c((1:7) == 4))

g2 <- make_graph(edges = c(1, 2, 2, 3, 3, 1,
                           # Cut vertex between 3 and 4
                           3, 4,
                           4, 5, 5, 6, 6, 7, 7, 4),
                 directed = FALSE) %>%
  set_edge_attr(name = "cut", value = c((1:8) == 4))

p1 <- ggraph(g1, layout = "igraph", algorith = "fr") +
  geom_edge_link(linewidth = 1,
                 color = "black") +
  geom_node_point(size = 7, aes(color = cut)) +
  ggtitle("Cut Node") +
  theme_graph() +
  theme(plot.title = element_text(hjust = 0.5))

p2 <- ggraph(g2, layout = "igraph", algorith = "fr") +
  geom_edge_link(linewidth = 1, aes(color = cut)) +
  geom_node_point(size = 6) +
  ggtitle("Cut Edge") +
  theme_graph() +
  theme(plot.title = element_text(hjust = 0.5))

p1 + p2